Our Work
We’re a web development company at our core, but with an eye for everything digital!
Check out our methodology to see how we work.
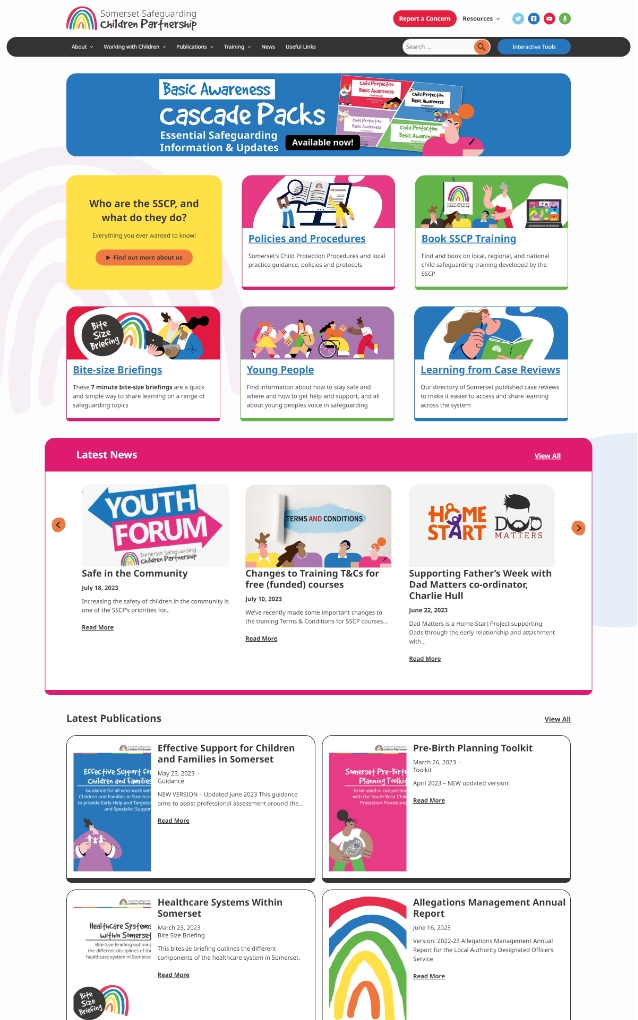
Somerset Safeguarding Children
Brightly coloured with easily accessible vast amounts of vital information for safeguarding.
WordPress development, Web design, UX and accessibility, Web applications...
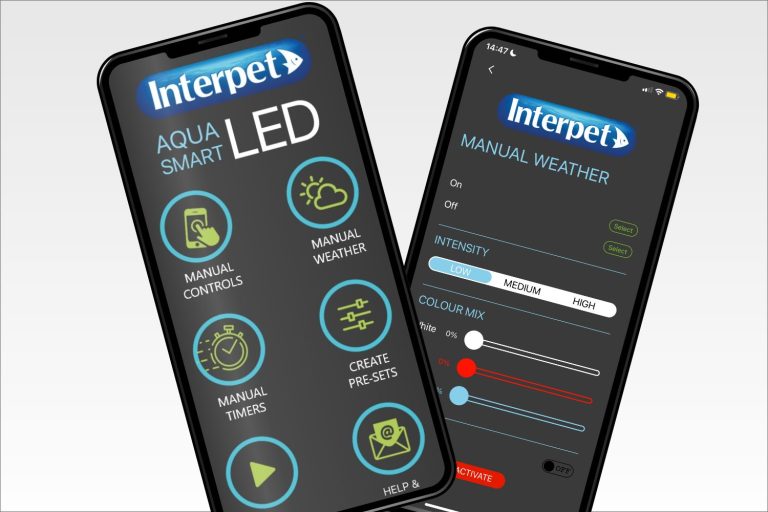
Interpet Aqua Smart app
Control and configure Aqua Smart LED aquarium lighting from their smartphone on their new app.
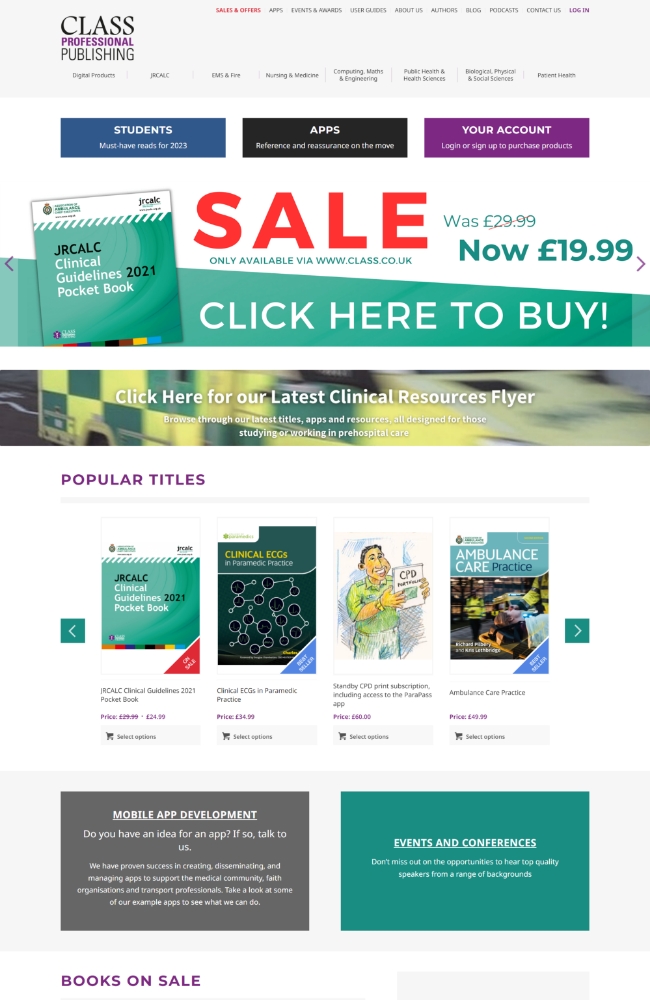
Class Professional Publishing
Complete website redesign and rebuild for Class Professional Publishing.
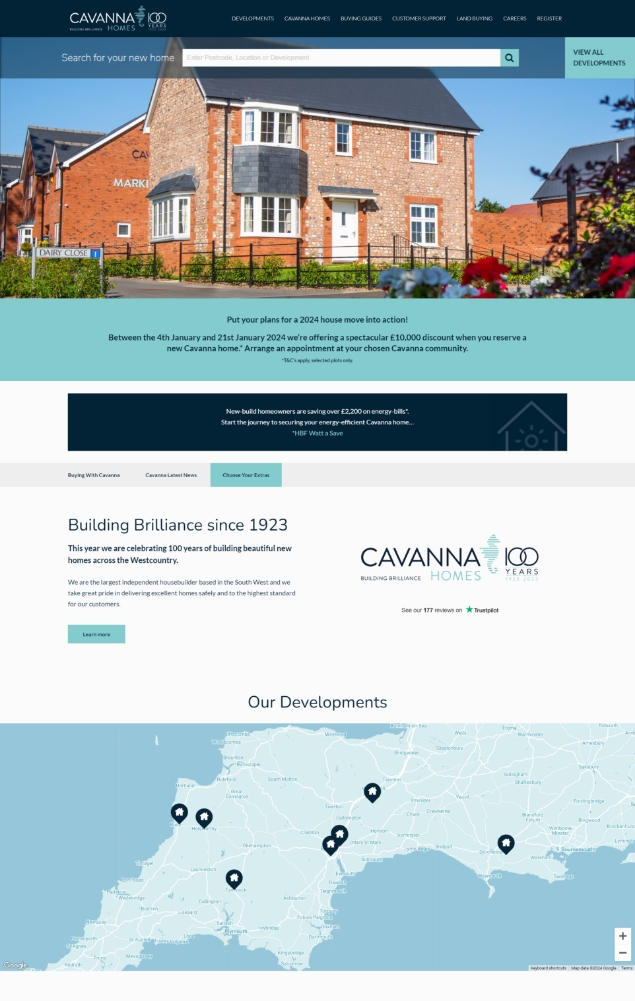
Cavanna Homes
Bespoke interactive website for the largest independent house builder based in the South West.
WordPress development, Maintenance & support, Brochure websites, Web design...
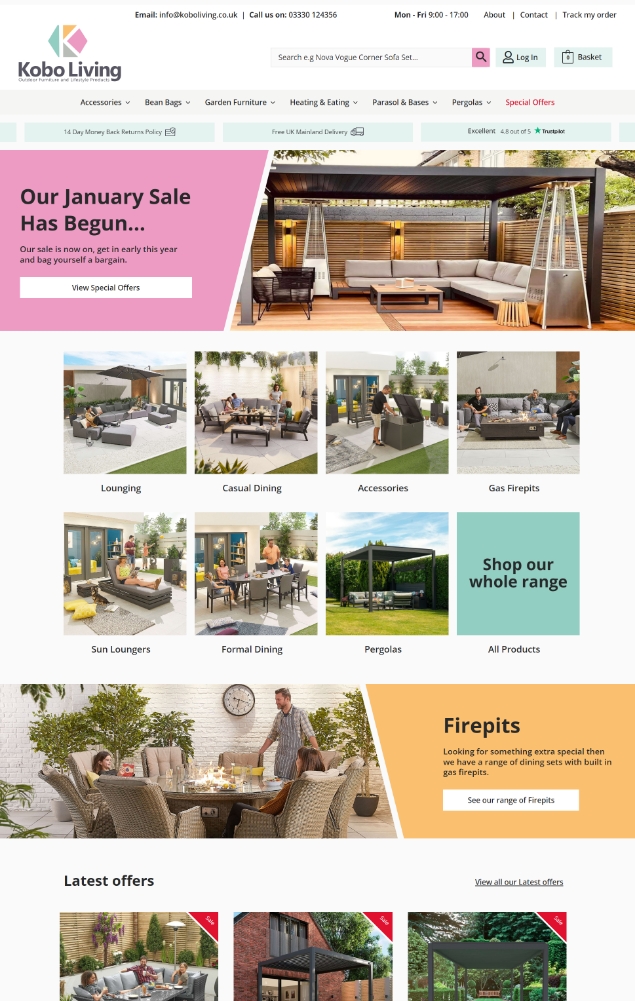
Kobo Living
Friendly, welcoming and fully responsive ecommerce website for outdoor furniture and lifestyle products.
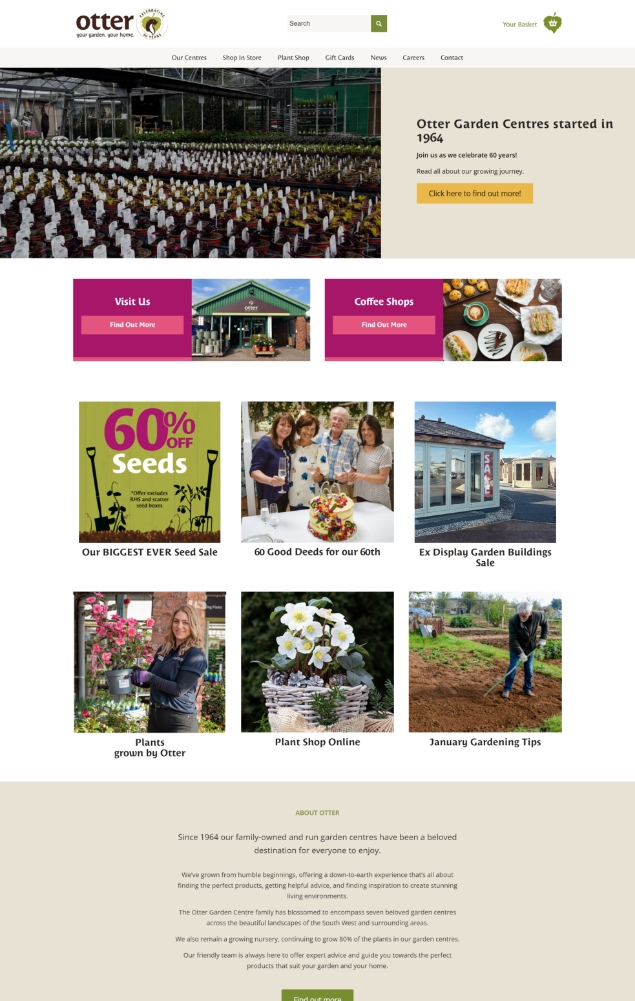
Otter Garden Centres
Customised CMS manging multiple locations with a plant shop and gift card system.
Blaze Concepts branding
Developing a completely new brand identity for our digital agency.
Doveleigh Care branding
A full vector redraw and refresh of a clients existing logo for the modern era.
Branding and logo design, Vectorise graphics, Digital design
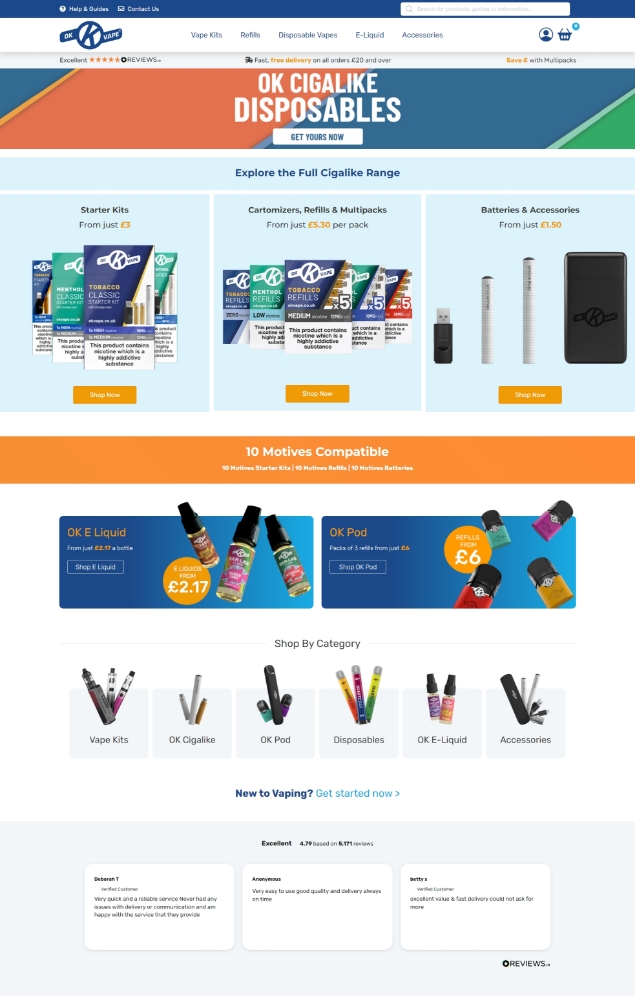
OK Vape
The UK's No.1 Independent Cigalike E Cig Brand serving tens of thousands of customers.
WordPress development, Search engine marketing, Ecommerce solutions
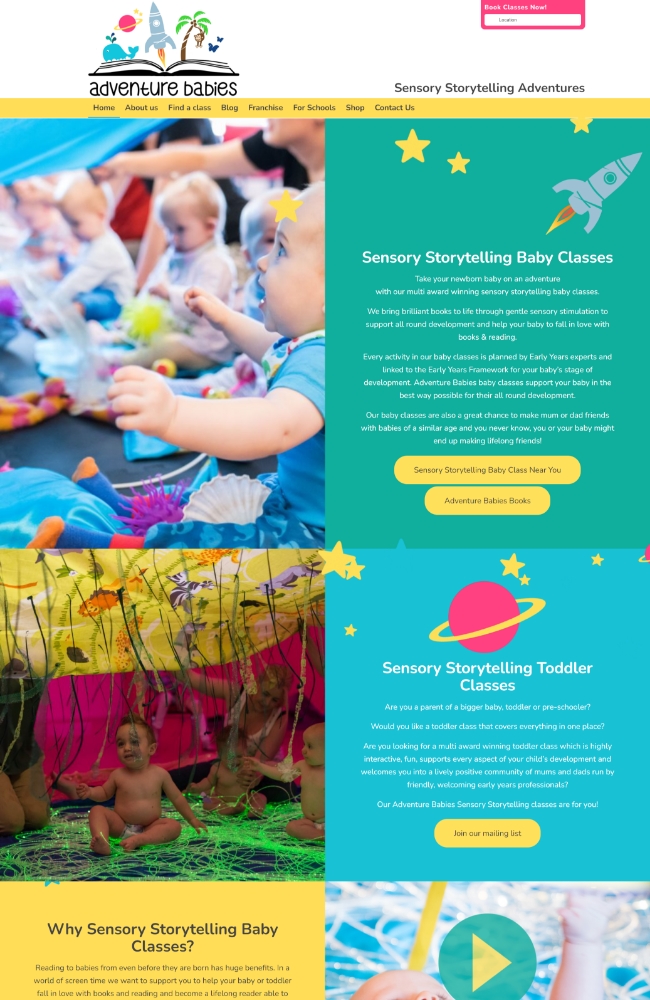
Adventure Babies
Unique and interactive approach to early childhood education, focusing on the power of storytelling and sensory experiences to engage and stimulate young minds.
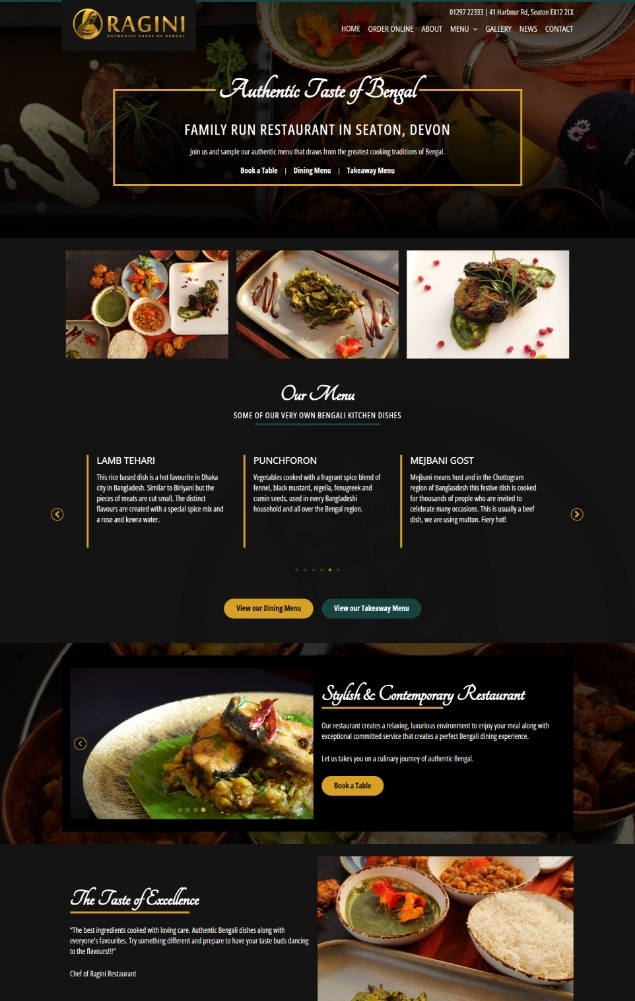
Ragini Restaurant
An engaging brochure website allowing the food photography to really shine for this family run restaurant in Devon.
Brochure websites, Web design, WordPress development, UX and accessibility...
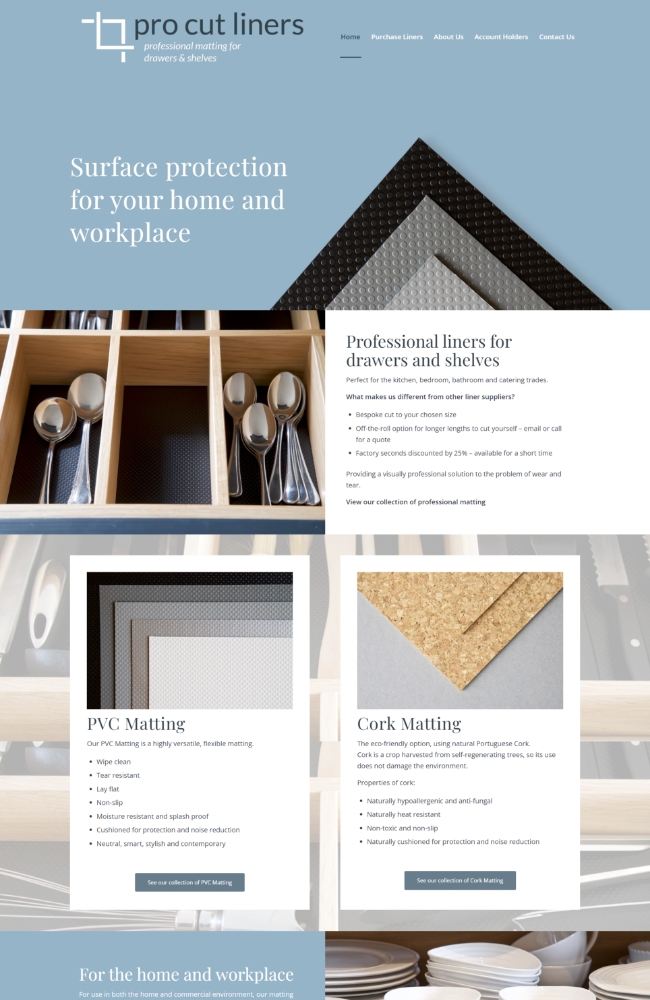
Pro Cut Liners
Clean and modern ecommerce website with a focus on high quality photography.
Brochure websites, Web design, Ecommerce solutions, WordPress development...
Beacon Education
A full website redesign and rebuild for an educational trust to match their vibrant new branding.
Brochure websites, Web design, Search engine marketing, WordPress development...
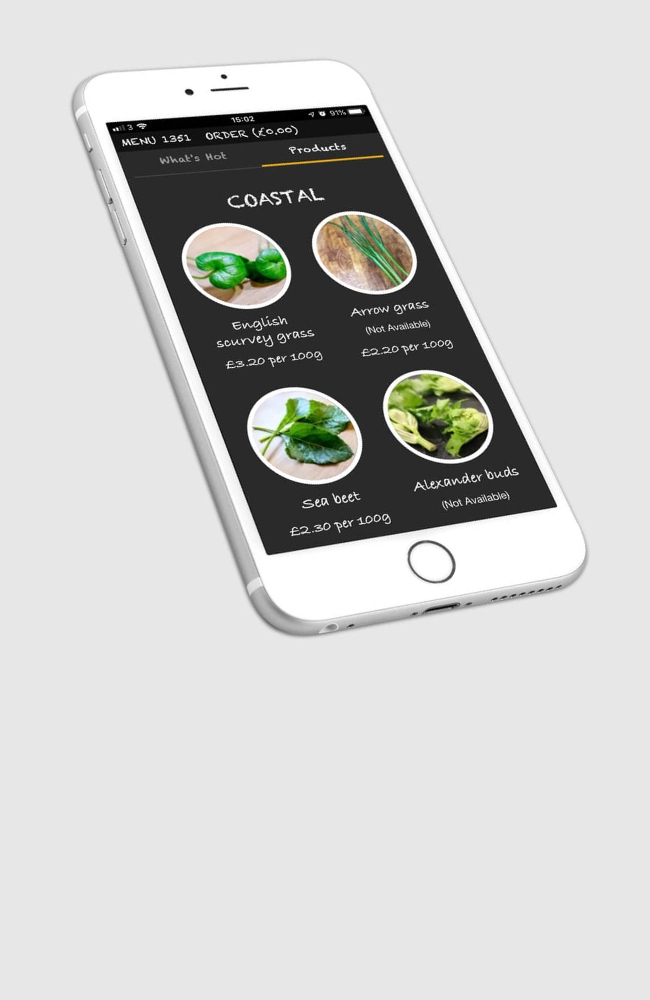
Bello Wild Foods
An IOS app connecting chefs directly to some of the best foragers in the UK bringing them the best seasonal wild edibles in UK.
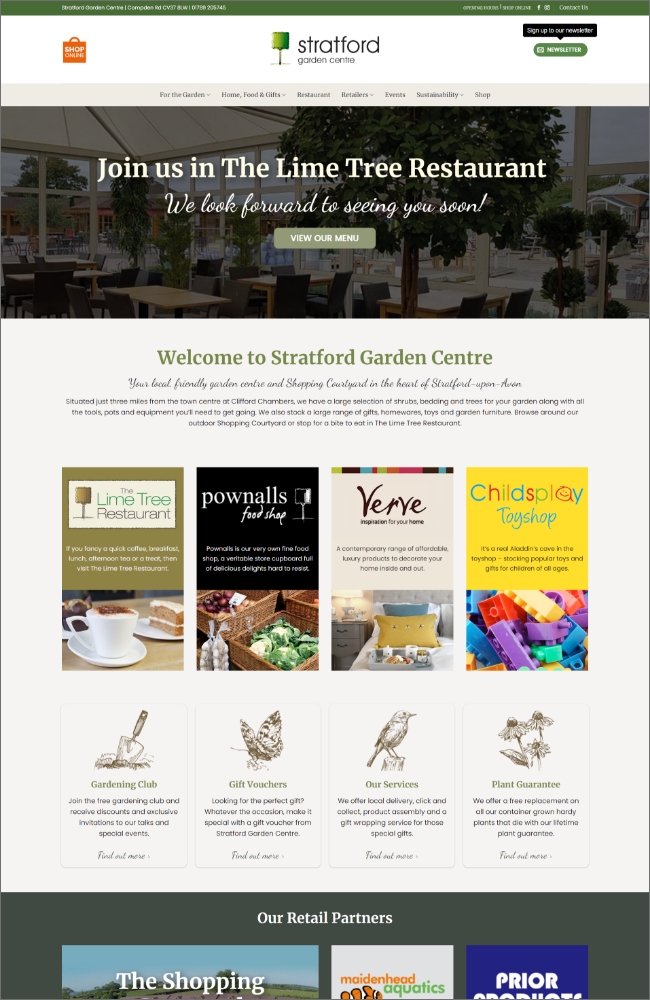
Stratford Garden Centre
Looking for a new web agency to take on maintenance, support and hosting of their website.
WordPress development, Web design, UX and accessibility, Ecommerce solutions...
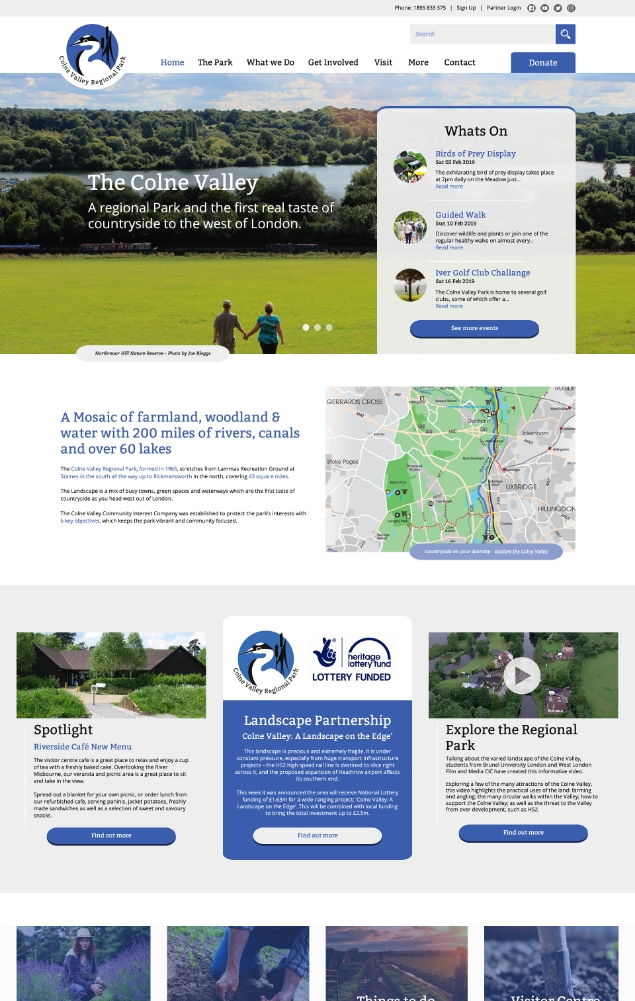
Colne Valley Regional Park
New website for Colne Valley Regional Park, the first substantial taste of countryside to the west of London.
Brochure websites, Web design, WordPress development, Websites
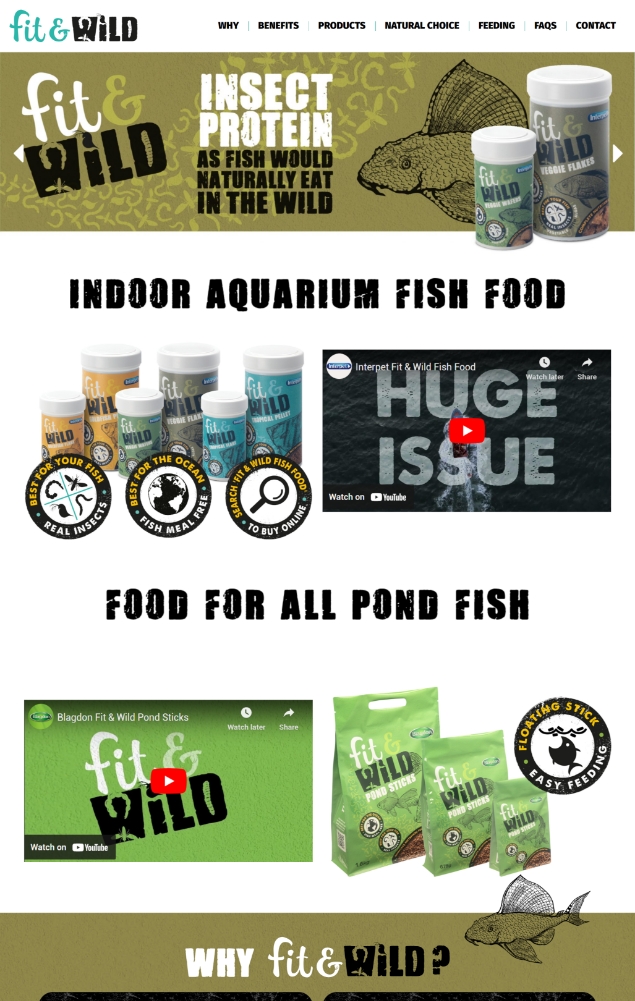
Fit and Wild
Working in partnership to produce a brochure website for fish food products from Interpet and Blagdon.
Brochure websites, Websites, WordPress development, Web design...
Simerly
Producing a unique brand identity for a new and exciting events based dating platform.